


Written by
Dr. Robin Freeman
Lead of the Conservation AI Lab
18 November 2020
The Living Planet Index – data analysis, clusters and biodiversity loss
In September WWF published the 2020 Living Planet Report – a report that tracks the status and trends of wildlife populations across the globe, using ZSL’s Living Planet Index.
Tracking the status and trends of wildlife is critical both for understanding the health of the ecosystems on which we rely, but also to identify those animals and places that are most in need of conservation action.
Living planet report data
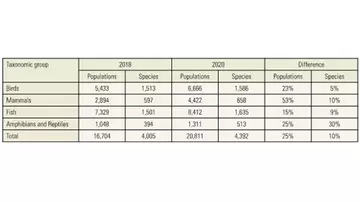
In the 2020 report, data was drawn from 20,811 populations of 4,392 species, and revealed an average 68% decline in monitored populations between 1970 and 2016: a statistic that threw a spotlight on biodiversity loss and can be used to spur conservation action in the areas where it is needed the most.
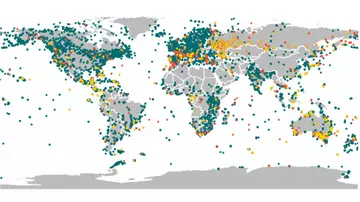
To calculate the Living Planet Index itself, we combine population trend data into a global index using time-series modelling and a weighted average, giving us a single trend of average changes in abundance since 1970. But we know that biodiversity trends can differ in different places - in the latest Living Planet Report, we identified differences in average population trends in different IPBES regions (the geographic regions defined by the Intergovernmental Science-Policy Platform on Biodiversity and Ecosystem Services).
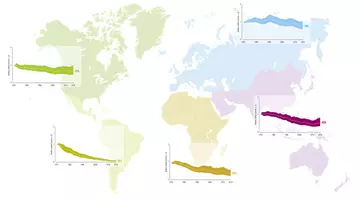
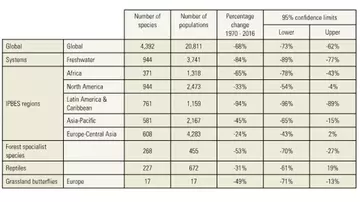
We also know that the pattern of the global trend is not the same for all species in all regions (Figure 1 & Table 1). For example, populations in temperate regions such as Europe-Central Asia and North America have, on average, declined less severely than those in tropical regions. One reason for this may be that the impacts on wildlife in these northern regions might have occurred prior to the baseline year of the Living Planet Index, which is 1970.
Biodiversity loss research
Research into biodiversity loss and its trends never stops: in a new report I co-authored, published today in Nature (Leung et al. Nature 2020), we highlight that the underlying statistic of the LPI can be sensitive to both extreme population increases and declines – this isn’t a new revelation (see Gregory, et al. 2019; Buckland et al., 2011), but it is an interesting one to explore.
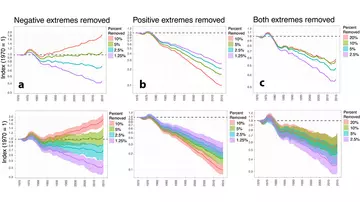
In this latest data analysis we explored removing the most declining populations (resulting in a shift of the average trend to stable) in addition to removing the most increasing populations, and removing both sets of populations together. Figure 2 replicates this analysis using our most up-to-date dataset of 20,000 populations (from LPR 2020). This includes removing the most declining populations (Figure 2a), removing the most increasing populations (Figure 2b) and also removing both (Figure 2c). Importantly, removing 10% from both extremes (20% of the populations) still reveals a decline of 42% since 1970.
Methodology of monitoring biodiversity loss
We then used a new method to identify and highlight clusters of extreme declines. We found extreme declines occurring in 16 species-group/regions - in particular species-groups like Indo-Pacific birds, or tropical reptiles. These clusters represent just a small number of populations (about 1%) from the overall total. Removing these clusters leaves a distribution of populations that appear, on average, to be stable.
However, this doesn’t mean that the remaining 99% of all populations in the LPI are doing fine. While there is no overall average trend across these species, this masks important underlying variation. In particular, three groups across the Indo-Pacific show widespread declines and there is some suggestion that smaller species may be more impacted than larger species.
It is also important to note that the LPI analysis focuses on population declines - our dataset includes many populations of the same species. While the new analysis published in Nature would consider populations of the same species separately, the LPI would average them together for an overall species trend.
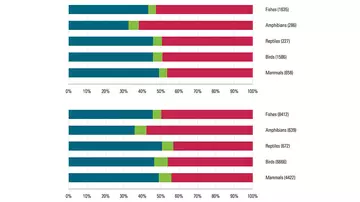
Global planet index findings explained
In the global LPI we see an average population decline of 68%. This represents an overall average, with some populations declining more and others that have not declined as much, or are even increasing. The average trend calculated for each species in the LPI shows that just over half of reptile, bird and mammal species are stable or increasing (Figure 3, top). Conversely, the average trend for over 50% of fish and amphibian species shows a decline. When we explore how LPI populations are changing we observe a similar picture; roughly 50% of them are increasing and 50% are declining (Figure 3, bottom). As the number of species which have positive and negative trends are more or less equal, this highlights that the magnitude of the declining trends must exceed that of the increasing trends resulting in an average decline for the global LPI. We also note that these declines are more likely in regions that have a larger number of species. This is why the Living Planet Index uses a weighting system, otherwise it would be heavily weighted towards well-monitored locations.
Monitoring red kite populations
The important point is that biodiversity trends vary, and in important ways. Better understanding of where and why some species are in particular decline is critical. Identifying these animals or places is an important step in prioritising conservation effort.
However, composite indices like the Living Planet Index (or others like the Red List Index1, or Biodiversity Intactness Index2 ) are still some of the best overall measurements we have for outlining the global state of nature. The global LPI trend is an important tool in communicating to policymakers and to the general public, to catalyse attention and encourage a broader conversation around biodiversity loss. Indicators like the Living Planet Index can serve as barometers of ecosystem health, in the same way that stock market indices can indicate overall trends while containing a variety of different underlying stock trends.
Our growing open-access Living Planet Database provides unique opportunities to explore the drivers of global wildlife population change. It can be examined in greater detail to explore how particular species and regions are changing, or how different drivers are influencing population trends.
Together for wildlife
Join us on our journey restoring wildlife across the world, and get the latest updates our progress, whether it's reintroducing tiny dormice or saving rhino's from poachers.